RO Membrane Desalination Rate 2026: Understanding Standard, Actual, and System Rejection Rates
The desalination rate of reverse osmosis membrane elements is the most critical performance parameter in RO system design and operation. Understanding the difference between standard desalination rate, actual desalination rate, and system desalination rate is essential for accurate system performance prediction, equipment acceptance, and ongoing membrane condition monitoring. This guide explains the RO membrane desalination rate in detail, covering how each rate is defined, measured, and applied in real-world RO water treatment systems.
1. What Is RO Membrane Desalination Rate?
The RO membrane desalination rate (also called salt rejection rate) measures the percentage of dissolved solids removed by a reverse osmosis membrane. It is calculated as:
Desalination Rate (%) = (1 — Permeate TDS / Feed TDS) × 100
For example, if feed water has 1,000 ppm TDS and permeate has 10 ppm TDS, the desalination rate is (1 — 10/1000) × 100 = 99.0%. Modern thin-film composite RO membranes achieve desalination rates of 99.0-99.8% for sodium chloride under standard test conditions. However, the actual RO membrane desalination rate in a real installation depends on feedwater composition, temperature, pressure, and system design parameters.
2. Standard Desalination Rate of Membrane Elements
The standard desalination rate is measured by membrane manufacturers under strictly controlled laboratory conditions using a sodium chloride (NaCl) test solution. Key standard test conditions include:
| Parameter | Standard Test Value |
|---|---|
| Feed solution | 2,000 ppm NaCl |
| Operating pressure | 1.55 MPa (225 psi) |
| Temperature | 25°C (77°F) |
| Recovery rate | 15% |
| pH range | 6.5-7.0 |
For example, Hydranautics CPA2 low-pressure RO membranes have a minimum standard desalination rate of 99.2% (average 99.5%), while CPA3 membranes achieve 99.6% minimum (average 99.7%). These values are the benchmark for comparing membrane element performance but should not be confused with actual or system desalination rates. Understanding the calculation methods for RO desalination rate is essential for proper system evaluation.
3. Actual Desalination Rate vs. Standard Rate
The actual desalination rate of RO membrane elements in operation can differ significantly from the standard rate due to several factors:
- Feedwater composition: Real water contains multiple ions (Ca²⁺, Mg²⁺, Na⁺, Cl⁻, SO₄²⁻, HCO₃⁻), each with different rejection characteristics. Multivalent ions like calcium and sulfate are rejected at rates >99.5%, while monovalent ions like sodium and chloride may be rejected at only 95-98%.
- Temperature effects: Water flux increases by approximately 3% per °C. Higher temperatures increase salt passage (reduce rejection), while lower temperatures increase rejection but reduce productivity.
- Operating pressure: Higher pressure increases both flux and desalination rate up to a plateau point.
- Recovery rate: Higher recovery concentrates feedwater, increasing osmotic pressure and reducing net driving pressure, which lowers desalination rate.
- Membrane fouling: Scale or biofilm on the membrane surface reduces effective rejection area and can physically damage the membrane.
These factors mean the actual RO membrane desalination rate is typically 0.5-2.0% lower than the standard rate in real operating conditions. Read more about how to improve the RO desalination rate for practical optimization strategies.
4. System Desalination Rate vs. Element Desalination Rate
The system desalination rate represents the overall salt rejection of the complete RO system, which typically contains multiple membrane elements arranged in series within pressure vessels. Several factors make the system rate different from individual element rates:
- Series configuration: In a vessel with 6-7 elements in series, feedwater becomes progressively more concentrated. The last element operates at much higher TDS than the first, reducing its incremental desalination contribution.
- Flow imbalance: Elements closer to the feed end produce more permeate at lower TDS, while tail-end elements produce less permeate at higher TDS. The blended permeate has an average TDS weighted by each element’s flow and rejection.
- O-ring and seal leakage: Any bypass of feedwater past membrane interconnectors or brine seals reduces the effective system desalination rate.
For a system with only one membrane element, the system desalination rate equals the actual element desalination rate. For multi-element systems, the system rate is always lower than the rate of the lead element alone.
5. Factors That Affect RO Membrane Desalination Rate Performance
| Factor | Effect on Desalination Rate | Typical Impact |
|---|---|---|
| Feed TDS increase | Higher osmotic pressure reduces net driving force | -0.1 to -0.3% per 1,000 ppm increase |
| Temperature increase | Increases salt diffusion through membrane | -0.1 to -0.2% per 5°C increase |
| Pressure increase | Increases net driving pressure, improves rejection | +0.1 to +0.3% per 100 psi increase |
| Membrane age | Gradual chemical degradation over time | -0.5 to -1.0% per year |
| Fouling/scaling | Physical blocking and concentration polarization | -1.0 to -5.0% if severe |
Monitoring these factors helps operators maintain optimal RO membrane desalination rate and identify problems before they cause significant performance loss. The direct drinking water system design also considers desalination rate expectations for system guarantees.
6. Measuring and Verifying RO Membrane Desalination Rate
Accurate measurement of RO membrane desalination rate requires proper sampling and instrumentation:
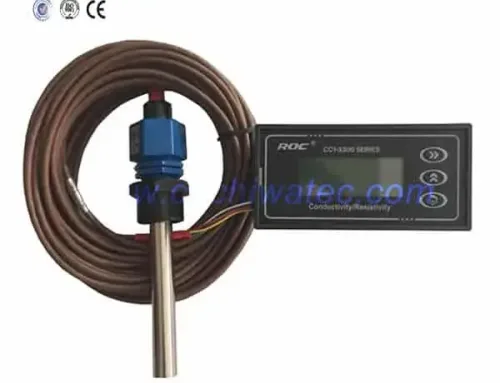
- Conductivity measurement: Online conductivity meters at feed and permeate provide continuous monitoring. Convert conductivity (μS/cm) to TDS (ppm) using a conversion factor of 0.55-0.70 for typical RO feedwater.
- Grab sample analysis: Laboratory analysis of feed and permeate for specific ions provides more accurate rejection data for individual contaminants.
- Stage-by-stage monitoring: Installing sampling ports between stages allows identification of which stage has declining performance.
- Normalization: Correct measured data to standard conditions (25°C, standard pressure) using membrane manufacturer normalization software for valid performance trending.
Regular desalination rate monitoring should be performed at least weekly for critical systems and monthly for standard installations. A sudden drop of more than 1% in RO membrane desalination rate indicates a problem requiring immediate investigation.
7. Frequently Asked Questions
Q1: What is a good RO membrane desalination rate?
A good RO membrane desalination rate for new thin-film composite membranes is 99.0-99.8% under standard test conditions. In actual operation, rates of 97-99% are considered acceptable for most applications. For high-purity applications like pharmaceutical or electronics, rates above 99% are typically required.
Q2: Why is my RO desalination rate lower than the manufacturer specification?
The manufacturer standard rate is measured under ideal laboratory conditions (2,000 ppm NaCl, 25°C, 15% recovery). Your actual rate is always lower due to different feedwater composition, temperature, pressure, recovery rate, and membrane age. A difference of 1-3% between standard and actual rates is normal. If the difference exceeds 5%, investigate for fouling, scaling, or membrane damage.
Q3: How does temperature affect RO membrane desalination rate?
Temperature affects both water viscosity and salt diffusion rates. For every 5°C increase in feedwater temperature, the RO membrane desalination rate typically decreases by 0.1-0.2% while water flux increases by approximately 15%. Conversely, lower temperatures increase rejection but reduce productivity. This is why RO performance data should always be normalized to 25°C.
Q4: Can a low desalination rate indicate membrane damage?
Yes. A sudden drop in RO membrane desalination rate of 1-2% or more, especially if accompanied by increased permeate flow, strongly indicates membrane damage such as oxidation from chlorine exposure, abrasion from suspended particles, or O-ring seal failure. Conduct an integrity test and inspect membrane elements to identify the root cause.
Q5: What is the difference between salt rejection and salt passage?
Salt rejection (desalination rate) is the percentage of salt removed: Rejection (%) = (1 — Cp/Cf) × 100. Salt passage is the percentage that passes through: Passage (%) = 100 — Rejection (%). For example, a membrane with 99.0% rejection has 1.0% salt passage. Salt passage is often a more useful parameter for tracking performance decline because it changes linearly — a change from 1.0% to 1.5% passage is a 50% increase in salt leakage but only a 0.5% decrease in rejection.
8. Conclusion: Mastering RO Membrane Desalination Rate for Optimal System Performance
Understanding the RO membrane desalination rate — including the distinction between standard, actual, and system rates — is fundamental to successful RO system design, operation, and troubleshooting. By correctly interpreting these different rate values, engineers and operators can set realistic performance expectations, conduct meaningful acceptance testing, and identify performance degradation early.
Need expert assistance with RO system design, membrane selection, or performance optimization? Contact CHIWATEC today:
📧 [email protected] or [email protected]
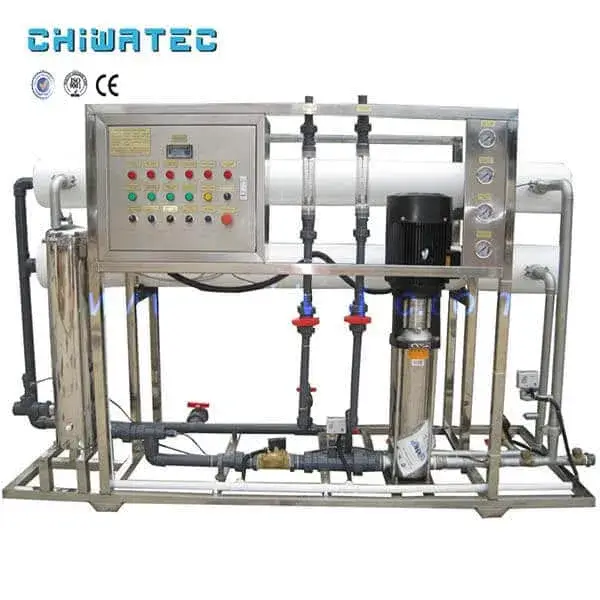
Our team provides complete RO water treatment systems from 125 L/H to 50,000 L/H with comprehensive performance guarantees and technical support.
9. Related Resources and Further Reading
- How to Calculate Reverse Osmosis Desalination Rate — Step-by-step calculation methods for RO rejection
- How to Improve Reverse Osmosis Desalination Rate — Practical strategies for optimizing RO system performance
- Application of Reverse Osmosis Pure Water in Winemaking — RO desalination in specialized industrial applications
- Best Practices for Antiscalant Treatment in RO Systems — Protecting membrane desalination performance through pretreatment
🔧 View Our RO Water Treatment Systems — Complete RO systems with guaranteed desalination rates
Do you have a water treatment project we can help with
* Designing,machining,installing,commissioning, customize and one-stop service
