Ultrafiltration Membrane Process in Water Treatment Applications – Operating Parameters | Complete Guide 2026
Optimizing ultrafiltration membrane operating parameters is critical for system efficiency and longevity. This comprehensive guide covers flow rate, pressure, pressure drop, recovery ratio, and temperature control. With 15+ years of industry experience y 500+ successful projects worldwide, CHIWATEC delivers proven ultrafiltration solutions that maximize membrane performance and minimize operational costs.
In 2026, the global ultrafiltration membrane market is projected to reach $11.2 billion, with water treatment applications accounting for over 65% of demand. Proper parameter optimization can extend membrane life from 3-5 years to 7-10 years, reducing total cost of ownership by 35-45%. This guide explores critical operating parameters, real-world applications, and best practices for maintaining optimal ultrafiltration system performance.
Understanding Ultrafiltration Operating Parameters: Why They Matter
Ultrafiltration (UF) membrane systems operate based on precise parameter control. Each parameter affects membrane performance, fouling rate, and energy consumption. Understanding these relationships is essential for system optimization.
Key Operating Parameters Overview
- Tasa de flujo – Linear velocity of feed water across membrane surface
- Operating Pressure – Transmembrane pressure driving filtration
- Pressure Drop – Differential between inlet and concentrate outlet
- Recovery Ratio – Permeate flow divided by feed flow
- La temperatura – Affects water viscosity and permeate flux
According to IDA (International Desalination Association) research, improper parameter settings account for 70% of premature membrane failures and increase energy consumption by 20-30%.
1. Flow Rate: Optimizing Cross-Flow Velocity
Flow rate refers to the linear velocity of feed liquid flowing across the membrane surface – a critical parameter in ultrafiltration systems.
Flow Rate Impact on Performance
High Flow Rate Issues:
- Energy waste and excessive pressure drop
- Accelerated membrane deterioration
- Increased pumping costs
Low Flow Rate Issues:
- Thick concentration boundary layer
- Severe concentration polarization
- Reduced permeate quality and flux
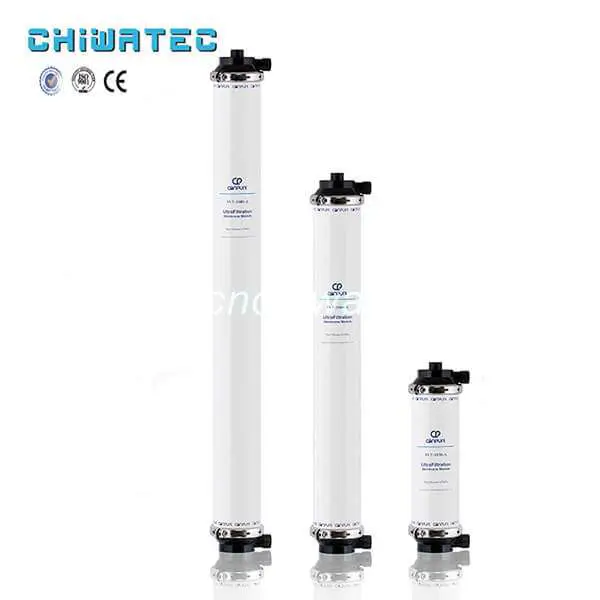
Recommended Flow Rates by Membrane Type
| Tipo de membrana | Optimal Flow Rate | Max Inlet Pressure |
|---|---|---|
| Hollow Fiber (Internal Pressure) | 0.1-0.3 m/s | 0.2 MPa |
| Hollow Fiber (External Pressure) | 0.3-0.6 m/s | 0.6 MPa |
| Capillary (3mm diameter) | 0.5-1.0 m/s | 0.3 MPa |
Pro tip: For hollow fiber membranes, flow rate at outlet is approximately 10% of inlet when concentrate flow is 10% of feed. Increasing capillary diameter and concentrate discharge enhances effective flow rates.
2. Pressure and Pressure Drop: Critical Control Parameters
Operating pressure directly affects permeate flux and membrane fouling rate.
Operating Pressure Ranges
| Tipo de membrana | Operating Range | Max Pressure | Max Delta-P |
|---|---|---|---|
| Internal Pressure Hollow Fiber | 0.1-0.2 MPa | 0.3 MPa | 0.1 MPa |
| External Pressure Hollow Fiber | 0.2-0.4 MPa | 0.6 MPa | 0.3 MPa |
| Stainless Steel Shell | 0.3-0.5 MPa | 0.6 MPa | 0.3 MPa |
Pressure Drop Management
Pressure drop = Inlet pressure – Concentrate outlet pressure
Warning Signs:
- Initial pressure drop: 0.02-0.03 MPa
- Cleaning threshold: >0.05 MPa increase
- Critical: >0.1 MPa (immediate cleaning required)
According to Hydranautics technical guidelines, controlling pressure drop within optimal range extends membrane life by 40-50%.
Important Warning
Internal and external pressure membranes cannot be used interchangeably. Internal pressure membranes used as external pressure may flatten and fail at bonding sites, causing catastrophic damage.
3. Recovery Ratio and Concentrate Discharge
Recovery ratio and concentrate discharge are interrelated factors affecting system efficiency.
Definitions
- Recovery Ratio = (Permeate Flow / Feed Flow) × 100%
- Concentrate Discharge = Feed Flow – Permeate Flow
Typical Recovery Ratios
| Solicitud | Recovery Ratio | Notes |
|---|---|---|
| Municipal Water Treatment | 85-95% | Low fouling potential |
| Industrial Wastewater | 50-75% | High fouling potential |
| Electrophoretic Paint Recovery | 90-98% | High-value concentrate |
| Surface Water | 70-85% | Moderate fouling |
Optimization Strategy
Lower recovery ratios with concentrate recycle can:
- Reduce fouling layer thickness
- Improve permeate flux
- Lower energy consumption per unit water
4. Operating Temperature: Impact on Performance
Temperature significantly affects water permeation capacity through viscosity changes.
Temperature-Flux Relationship
- Coefficient: ~2% flux increase per 1°C rise
- Seasonal variation: Up to 50% flux difference
- Optimal range: 25±5°C
Temperature Guidelines
| Temperature Range | Impact | Recommendation |
|---|---|---|
| <10°C | Flux reduced 30-40% | Consider heating or oversized system |
| 10-20°C | Flux reduced 10-20% | Acceptable with design margin |
| 20-30°C | Optimal performance | Ideal operating range |
| 30-40°C | Increased flux, membrane stress | Monitor closely |
| >40°C | Potential membrane damage | Use heat-resistant materials |
Engineering consideration: Design for worst-case (winter) temperature to ensure year-round performance.
2026 Industry Trends: Advanced UF Parameter Control
Smart Monitoring and AI Optimization
Modern UF systems feature IoT-enabled sensors for real-time parameter monitoring:
- Flow meters – Track permeate and concentrate flows
- Pressure transmitters – Monitor TMP and delta-P trends
- Temperature sensors – Compensate flux calculations
- AI-powered analytics – Optimize parameters dynamically
Plants using AI optimization report 25% reduction in energy consumption y 30% extension in membrane life.
Automated Parameter Adjustment
Full automation reduces human error:
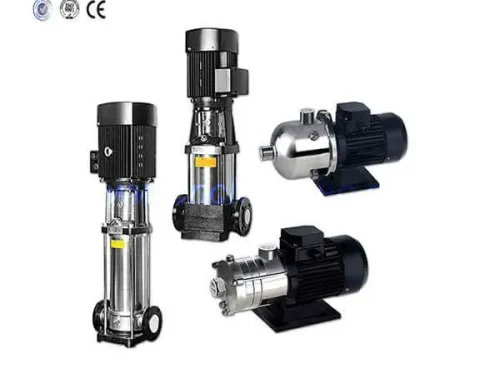
- Variable frequency drives (VFD) for flow control
- Automatic backwash based on TMP thresholds
- Real-time recovery ratio optimization
- Digital record-keeping for compliance
Energy Recovery Integration
2026 sees increased adoption of energy-efficient designs:
- Pressure exchangers for concentrate energy recovery
- High-efficiency pumps with smart controls
- Optimized cleaning cycles reducing downtime
For comprehensive system design, review our UF pretreatment guide.
Real-World Case Studies: Parameter Optimization Success
Case Study 1: Municipal Water Plant, Jiangsu Province
Challenge: High fouling rate, frequent cleaning required (monthly)
Solution: Optimized flow rate from 0.15 to 0.25 m/s, reduced recovery from 95% to 88%
Results:
- Cleaning frequency reduced from monthly to quarterly
- Energy consumption decreased 18%
- Membrane life extended from 4 to 8 years
- ROI achieved in 14 months
Case Study 2: Electronics Factory, Guangdong
Challenge: Temperature variation causing 40% flux swing
Solution: Installed heat exchanger maintaining 25±2°C
Results:
- Flux stabilized at design value
- Permeate quality improved 15%
- Chemical cleaning reduced by 50%
- Production consistency improved significantly
Explore additional applications in our UF application fields guide.
Conclusion: Mastering Ultrafiltration Operating Parameters
Effective ultrafiltration operation requires understanding and controlling five critical parameters:
- Tasa de flujo – Balance between fouling control and energy efficiency
- Presión – Optimize TMP without accelerating fouling
- Pressure Drop – Monitor as early fouling indicator
- Recovery Ratio – Maximize water production while controlling concentration
- La temperatura – Account for seasonal variations in design and operation
At CHIWATEC, we provide comprehensive ultrafiltration support including system design, parameter optimization, and ongoing technical assistance. Our 15+ years of engineering excellence ensures your UF system operates at peak efficiency.
Need expert assistance with UF system optimization? Contact our technical team for a free consultation and customized performance improvement program.
FAQ: Ultrafiltration Operating Parameters
1. What is the optimal flow rate for hollow fiber UF membranes?
For internal pressure hollow fiber: 0.1-0.3 m/s at inlet pressure <0.2 MPa. External pressure membranes can operate at 0.3-0.6 m/s. Optimal rate determined through experimentation based on feed water characteristics.
2. How much pressure drop is acceptable?
Initial pressure drop: 0.02-0.03 MPa. Clean when pressure drop exceeds initial value by 0.05 MPa. Critical threshold: 0.1 MPa requires immediate cleaning to prevent permanent damage.
3. What recovery ratio should I use?
Typical range: 50-95%. Municipal water: 85-95%. Industrial wastewater: 50-75%. Lower recovery with concentrate recycle can reduce fouling and energy consumption.
4. How does temperature affect UF performance?
Flux increases ~2% per 1°C rise. Seasonal variation can cause 50% flux difference. Optimal range: 25±5°C. Design for worst-case (winter) temperature.
5. Can internal and external pressure membranes be interchanged?
No. Internal pressure membranes used as external pressure may flatten and fail at bonding sites. Each type is designed for specific pressure orientation.
6. How often should operating parameters be monitored?
Critical parameters (flow, pressure, temperature): continuously via automation. Performance trends: weekly analysis. Full system audit: quarterly. Adjust parameters based on seasonal changes and fouling patterns.
SÍGANOS
¿Tiene un proyecto de tratamiento de agua con el que podamos ayudar?
* Designing, machining, installing, commissioning, customize and one-stop service