RO Membrane Performance Metrics: Key Evaluation Indicators & Operating Factors 2026
Meta Description: Comprehensive guide to reverse osmosis membrane evaluation metrics including desalination rate, water flux, and recovery rate. Learn how pressure, temperature, pH, and TDS impact RO membrane performance in 2026 water treatment systems.
Introduction: Why RO Membrane Performance Matters in 2026
Reverse osmosis (RO) membrane technology remains the cornerstone of modern water treatment, with the global RO membrane market projected to reach $14.8 billion by 2026, growing at a CAGR of 8.2%. Understanding reverse osmosis membrane performance metrics is critical for optimizing system efficiency, reducing operational costs, and ensuring consistent water quality across industrial, commercial, and residential applications.
This comprehensive guide covers essential RO membrane evaluation indicators, key influencing factors, and latest industry trends to help you maximize your water treatment system performance.
Core Evaluation Indicators of Reverse Osmosis Membranes
When assessing RO membrane quality, five primary performance metrics determine overall system effectiveness and long-term operational viability.
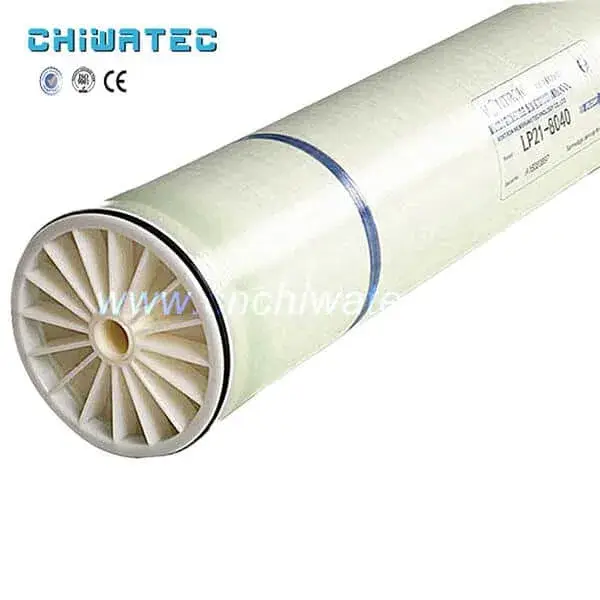
1. Desalination Rate and Salt Rejection
Desalination rate represents the percentage of dissolved solids removed from feedwater, calculated as:
Desalination Rate = (1 − Product Water TDS / Feed Water TDS) × 100%
Modern thin-film composite (TFC) RO membranes achieve:
- 99.5%+ salt rejection for monovalent ions (Na⁺, K⁺, Cl⁻)
- 99.8%+ rejection for divalent ions (Ca²⁺, Mg²⁺, SO₄²⁻)
- 99.9%+ removal of organic compounds with molecular weight >100 Daltons
The desalination layer density directly correlates with salt rejection—denser layers provide higher rejection but may reduce water permeability. Industry standards in 2026 require minimum 98% salt rejection for commercial RO membrane elements.
2. Water Production Rate (Water Flux)
Water flux measures the volume of permeate produced per unit membrane area, typically expressed in:
- GFD (Gallons per Square Foot per Day): Common in North American specifications
- LMH (Liters per Square Meter per Hour): International standard metric
Optimal flux ranges vary by application:
- Brackish water RO: 15-25 GFD (25-42 LMH)
- Seawater RO: 8-14 GFD (13-23 LMH)
- Ultrapure water systems: 20-30 GFD (34-51 LMH)
Excessive flux accelerates membrane fouling and compaction, while insufficient flux reduces system economics. The 2026 industry trend favors conservative flux design (10-15% below maximum) to extend membrane life.
3. System Recovery Rate
Recovery rate indicates the percentage of feedwater converted to product water:
Recovery Rate = (Permeate Flow / Feed Flow) × 100%
Typical recovery rates by application:
- Single-stage brackish RO: 50-75%
- Two-stage brackish RO: 80-85%
- Seawater RO: 40-50%
- Industrial wastewater RO: 60-70%
Higher recovery improves water efficiency but increases concentrate TDS, raising scaling risk. Advanced antiscalant formulations in 2026 enable 5-8% higher recovery rates compared to 2020 baseline systems.
4. Mechanical Strength and Compaction Resistance
RO membranes must withstand operating pressures of 150-1000 psi without structural degradation. Key indicators include:
- Burst pressure rating: Minimum 300% of operating pressure
- Compaction factor: <5% flux loss after 100 hours at rated pressure
- Cycle durability: Withstand 1000+ pressure cycles without delamination
5. Chemical and Biological Stability
Long-term membrane durability requires resistance to:
- pH range: 2-11 for continuous operation, 1-13 for cleaning
- Oxidant exposure: <0.1 ppm free chlorine (TFC membranes)
- Temperature range: 5-45°C for standard polyamide membranes
- Microbial attack: Biofilm-resistant surface coatings
Six Critical Factors Affecting RO Membrane Performance
Understanding how operational parameters influence RO membrane efficiency enables precise system optimization and predictive maintenance.
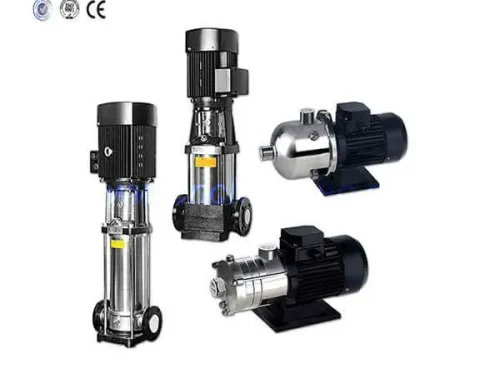
1. Feed Water Pressure
Operating pressure directly drives water permeation through the RO membrane. Key relationships:
- Water production increases linearly with net driving pressure (NDP)
- Salt passage remains relatively constant until concentration polarization dominates
- Optimal pressure range: 150-225 psi for brackish water, 800-1000 psi for seawater
Pressure effects on performance:
- +10 psi pressure increase → +3-5% water production
- Excessive pressure (>design limit) → accelerated compaction and fouling
- Insufficient pressure → reduced recovery and poor salt rejection
2026 best practice: Implement variable frequency drive (VFD) pumps with real-time NDP monitoring to maintain optimal pressure across varying feed conditions.
2. Feed Water Temperature
Temperature significantly impacts RO membrane permeability and salt passage:
- Water flux increases 2.5-3.0% per 1°C temperature rise
- Salt passage increases 3-4% per 1°C due to enhanced diffusion
- Viscosity reduction lowers pressure drop across membrane elements
Temperature correction formula:
Corrected Flux = Measured Flux × TCF (Temperature Correction Factor)
Standard reference temperature: 25°C. For every 10°C deviation, apply TCF adjustment of 1.2-1.3 multiplier.
Industry trend 2026: Low-temperature RO membranes with enhanced permeability at 5-15°C enable year-round consistent performance in cold climates without energy-intensive heating.
3. Feed Water pH
pH affects both membrane surface charge and contaminant speciation:
- Optimal pH range: 6.5-8.0 for maximum salt rejection
- pH 7.5-8.5: Converts dissolved CO₂ to HCO₃⁻/CO₃²⁻, improving rejection
- Low pH (<6): CO₂ exists as gas, easily permeates membrane
- High pH (>9): Risk of silica and carbonate scaling
pH impact on specific contaminants:
- Boron removal: >95% at pH 10-11 vs. 40-60% at pH 7
- Heavy metals: Optimal rejection at pH 7-8 (precipitation risk above pH 9)
- Organic acids: Higher rejection in ionized form (pH > pKa)
4. Feed Water TDS (Total Dissolved Solids)
Feedwater salinity determines osmotic pressure and required operating pressure:
- Osmotic pressure: ~1 psi per 100 ppm TDS (for NaCl)
- Pressure requirement: +0.007 MPa per 100 ppm TDS increase
- Salt passage: Increases with higher feed concentration gradient
TDS classification and typical applications:
- Low TDS (<500 ppm): Municipal water, groundwater → 150-200 psi
- Medium TDS (500-5000 ppm): Brackish water → 200-400 psi
- High TDS (35000-45000 ppm): Seawater → 800-1000 psi
5. Suspended Solids and SDI (Silt Density Index)
Particulate contamination causes physical fouling and flux decline:
- Maximum SDI₁₅: <5.0 (ideally <3.0)
- Turbidity limit: <0.5 NTU for RO feedwater
- Particle size: >5 μm must be removed by prefiltration
2026 pretreatment advances:
- Ultrafiltration (UF) pretreatment: SDI <2.0, 99.9% particle removal
- Automated backwash filters: Real-time turbidity monitoring
- Coagulation-flocculation: Enhanced colloidal removal for surface water
See related: Ultrafiltration Membrane Process in Water Treatment Applications – Pretreatment
6. Recovery Rate and Concentrate Flow
Recovery rate affects concentrate-side conditions:
- Higher recovery → increased concentrate TDS → higher scaling potential
- Concentrate velocity: Minimum 0.1 m/s to prevent particle deposition
- Pressure drop: Increases 0.02 MPa per 1% recovery change
Scaling risk management:
- Calcium carbonate: LSI (Langelier Saturation Index) <0 in concentrate
- Calcium sulfate: <230% of solubility limit in concentrate
- Silica: <100-120 ppm in concentrate (temperature dependent)
2026 Industry Trends and Technological Advances
The RO membrane industry continues evolving with focus on efficiency, sustainability, and smart monitoring:
Emerging Technologies
- Graphene oxide membranes: 2-3x higher flux with equivalent salt rejection (pilot stage)
- Biomimetic aquaporin membranes: Ultra-high permeability with precise ion selectivity
- Nanocomposite membranes: Enhanced fouling resistance and chlorine tolerance
- Low-pressure RO (LPRO): 20-30% energy reduction for brackish water applications
Sustainability Initiatives
- Zero liquid discharge (ZLD): 95-98% water recovery with crystallizer integration
- Energy recovery devices (ERD): 95-98% efficiency in seawater RO
- Membrane recycling programs: End-of-life element recovery and material reuse
Digital Monitoring and AI Optimization
- Real-time performance normalization: Automatic temperature, pressure, TDS correction
- Predictive fouling detection: Machine learning algorithms identify trends 2-4 weeks before critical thresholds
- Remote diagnostics: Cloud-based monitoring with automated alert systems
Related reading: Understanding the Filtration Mechanism and Operational Process of Reverse Osmosis (RO) Membranes
Conclusion: Optimizing Your RO System Performance
Maximizing reverse osmosis membrane performance requires balanced optimization of all evaluation indicators while managing six critical influencing factors. Key takeaways for 2026:
- Monitor baseline metrics: Establish normalized performance baselines for flux, salt rejection, and pressure drop
- Implement proactive maintenance: Schedule cleaning when normalized flux drops 10-15% or pressure drop increases 15-20%
- Optimize pretreatment: Invest in robust pretreatment to protect membrane investment (UF, antiscalant, dechlorination)
- Leverage smart monitoring: Use digital tools for real-time performance tracking and predictive analytics
- Balance recovery and efficiency: Operate at 70-85% of maximum recovery to extend membrane life
Proper understanding and management of RO membrane evaluation indicators ensures reliable, cost-effective water treatment for years of operation.
For advanced cleaning strategies, see: Optimized Reverse Osmosis Membrane Cleaning Process Flow
FAQ: Reverse Osmosis Membrane Performance
Q1: What is a good desalination rate for RO membranes?
A: Modern thin-film composite (TFC) RO membranes should achieve 98-99.5% salt rejection for brackish water applications and 99.5-99.8% for seawater. Industrial-grade membranes typically guarantee minimum 98% rejection, while premium membranes exceed 99.5%.
Q2: How often should RO membranes be cleaned?
A: Clean RO membranes when normalized permeate flow drops 10-15%, salt passage increases 10-15%, or normalized pressure drop increases 15-20% from baseline. Typical cleaning frequency ranges from 3-12 months depending on feedwater quality and pretreatment effectiveness.
Q3: What is the typical lifespan of an RO membrane?
A: With proper maintenance and optimal operating conditions, RO membranes last 5-7 years in brackish water applications and 3-5 years in seawater systems. Aggressive feedwater or poor pretreatment can reduce lifespan to 2-3 years.
Q4: How does temperature affect RO membrane performance?
A: Water flux increases 2.5-3.0% per 1°C temperature rise, while salt passage increases 3-4%. Standard performance ratings are at 25°C. Cold water (<15°C) requires higher operating pressure; warm water (>30°C) may need flux reduction to control scaling.
Q5: What is the maximum recovery rate for RO systems?
A: Maximum recovery depends on feedwater quality. Brackish water RO: 75-85% (two-stage). Seawater RO: 40-50%. Municipal wastewater RO: 70-80%. Exceeding design recovery increases scaling risk and reduces membrane life.
Q6: How can I improve my RO system energy efficiency?
A: Key strategies include: (1) Install energy recovery devices (ERD) for seawater systems, (2) Optimize operating pressure with VFD pumps, (3) Maintain proper pretreatment to reduce fouling, (4) Use low-pressure RO membranes for brackish applications, (5) Implement real-time monitoring for proactive optimization.
Further Reading:
¿Tiene un proyecto de tratamiento de agua con el que podamos ayudar?
* Diseño, mecanizado, instalación, puesta en marcha, personalización y servicio integral